
Overview
Metron Scanner is an internal design tooling project I initiated to help Gojek’s design teams collect, analyze, and visualize data from our design files. The goal was simple, to make design measurable.
By tapping into Figma’s REST API, Metron helps uncover insights about component usage, consistency, and adoption, things that were previously invisible to the team.
The Problem
Data collection in design is, for the most part, non-existent. Figma’s built-in analytics offer limited metrics that don’t scale well for large, complex ecosystems like Gojek’s.
Without data, it was nearly impossible to:
Quantify how well our design system was being adopted,
Identify inconsistencies across teams, or
Build a credible case for the design system’s value.
As a result, when product teams asked, “Why should we adopt this?”, we had no concrete, data-backed answers, only subjective opinions and experience.
The Opportunity
If we could extract raw design data from Figma and make it actionable, we could:
Reduce manual auditing work for designers,
Provide measurable feedback loops for the design system, and
Strengthen collaboration between design and product teams through shared insights.
This realization sparked the idea for Metron Scanner, a data layer for design.
Challenges
This is a design team initiative, no engineering team involved, so we don't access to store data in real database, no backend. We are trying to be more independent without relying too much to engineering team.
The Solution
We ended up host the web page in Gitlab page, I use NextJS and create a static site, all request calling directly the Figma's REST API, all the web app settings were stored in JSON files, we add a capability to export the raw data to CSV, from CSV file we use Metabase to present the data, adding more visual graph and dashboard.
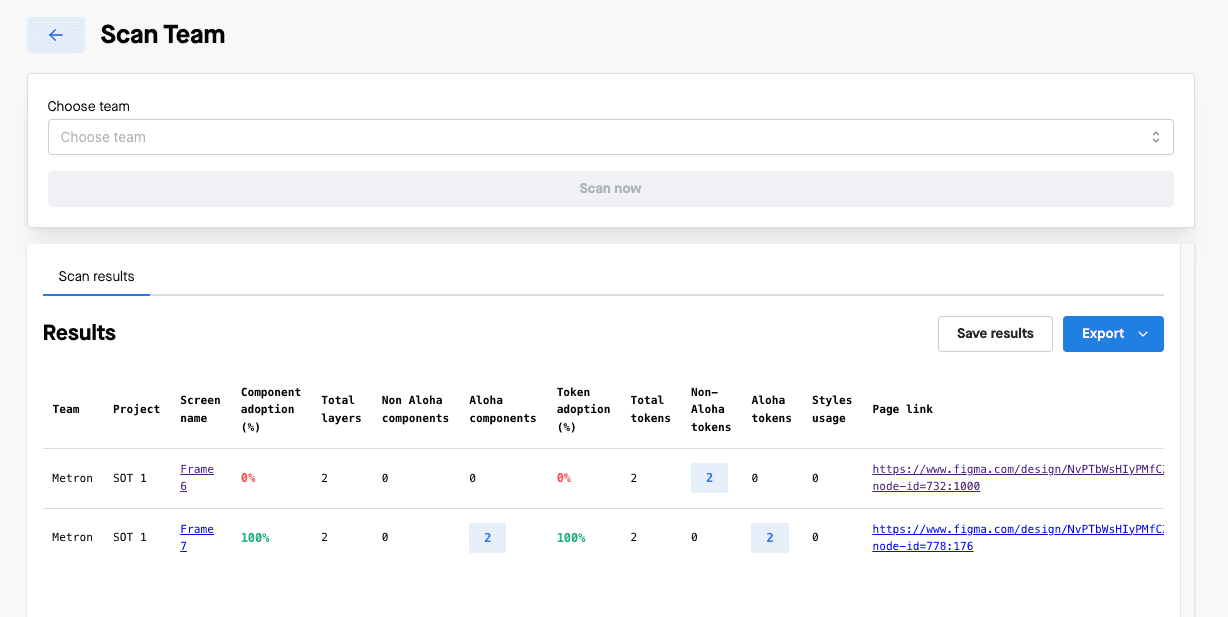
Metron Scanner connects directly to Figma’s REST API to analyze design files and surface meaningful metrics. It inspects layers, components, and styles, then translates that data into insights about design quality and consistency.
Key Capabilities
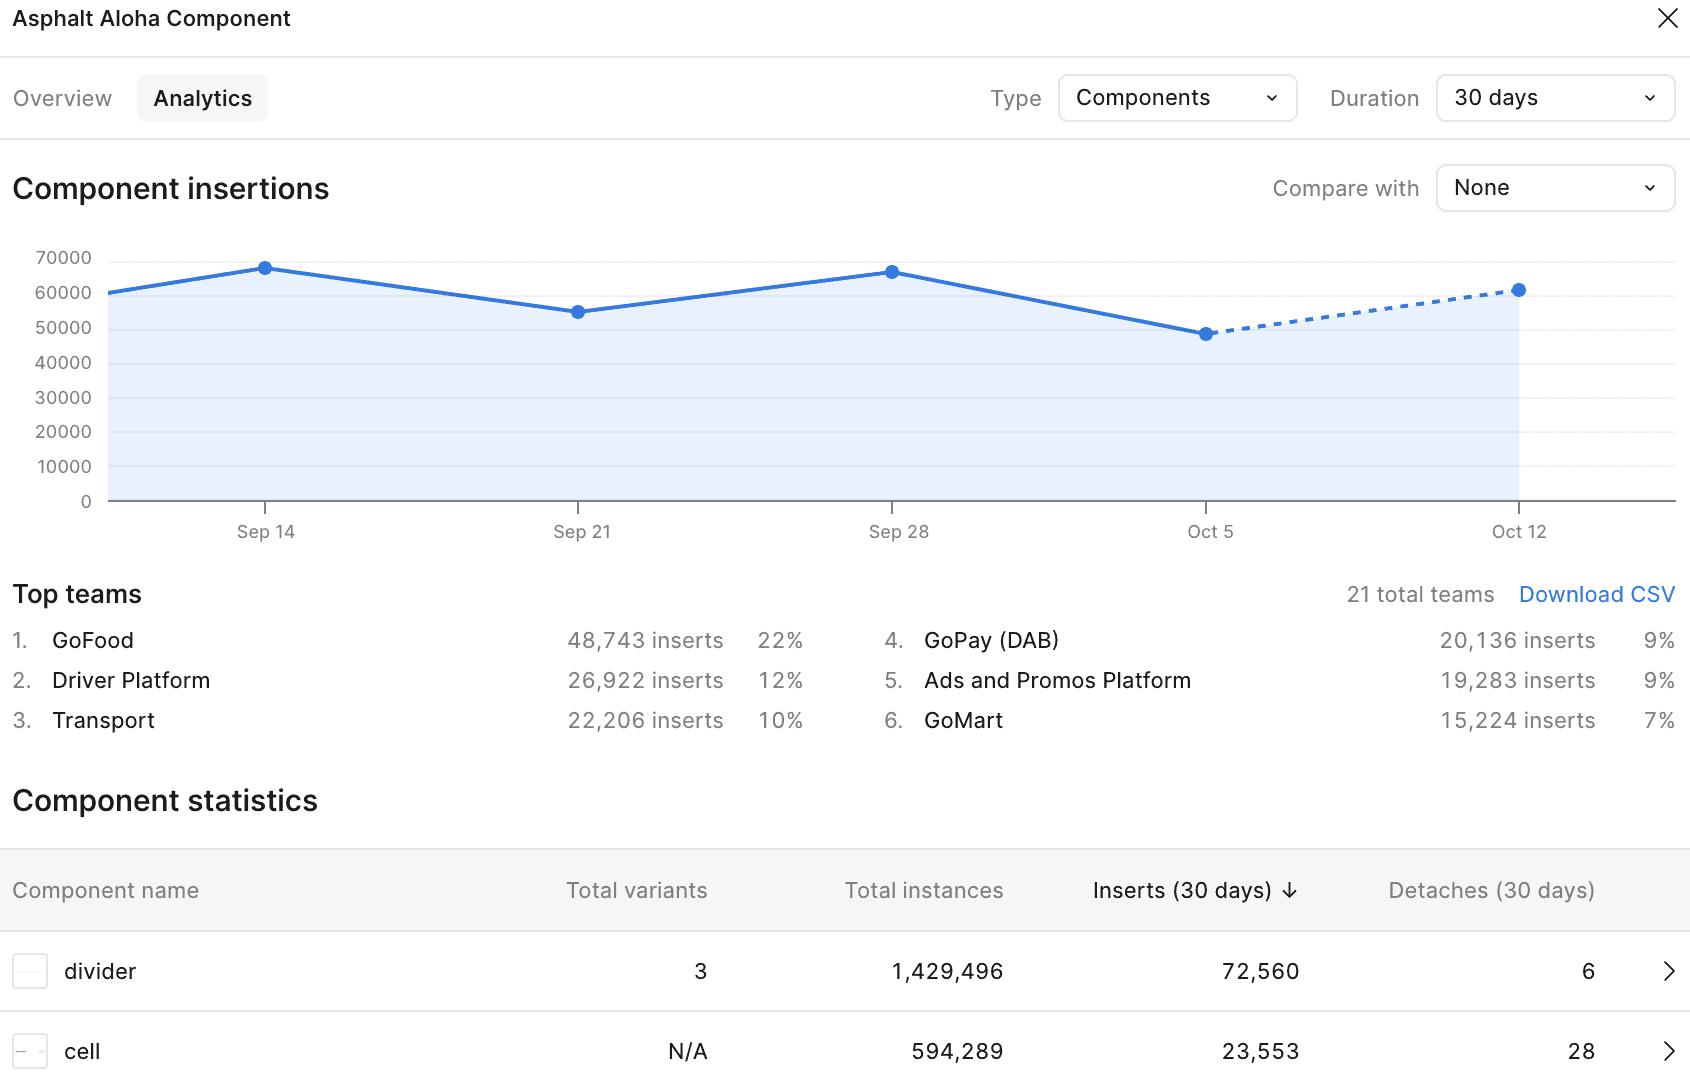
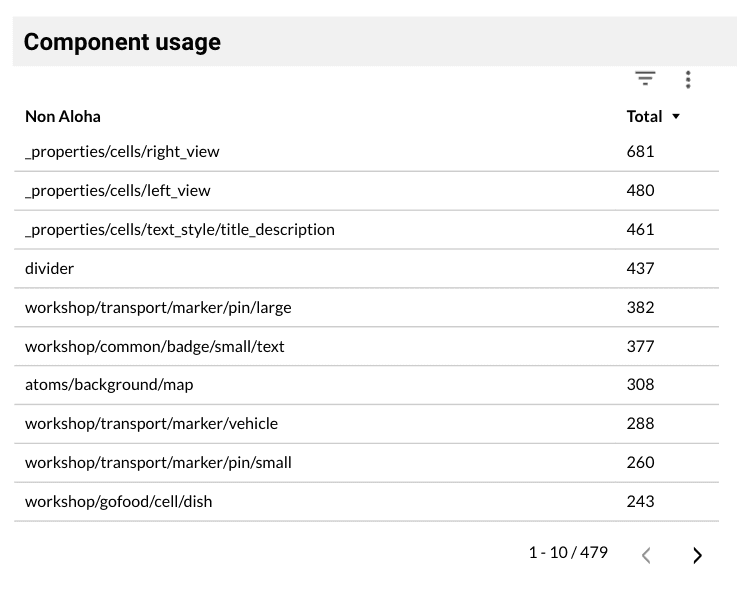
Component usage tracking – Understand which components are most (and least) used.
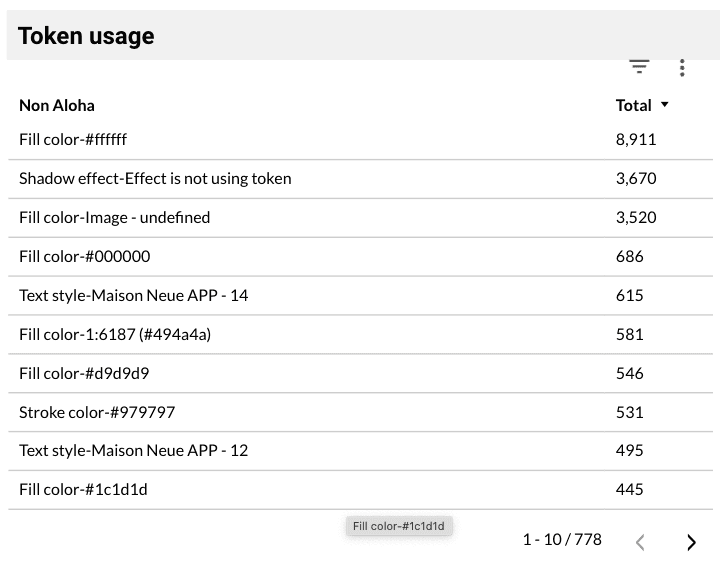
Consistency scoring – Detect naming, spacing, and token inconsistencies.
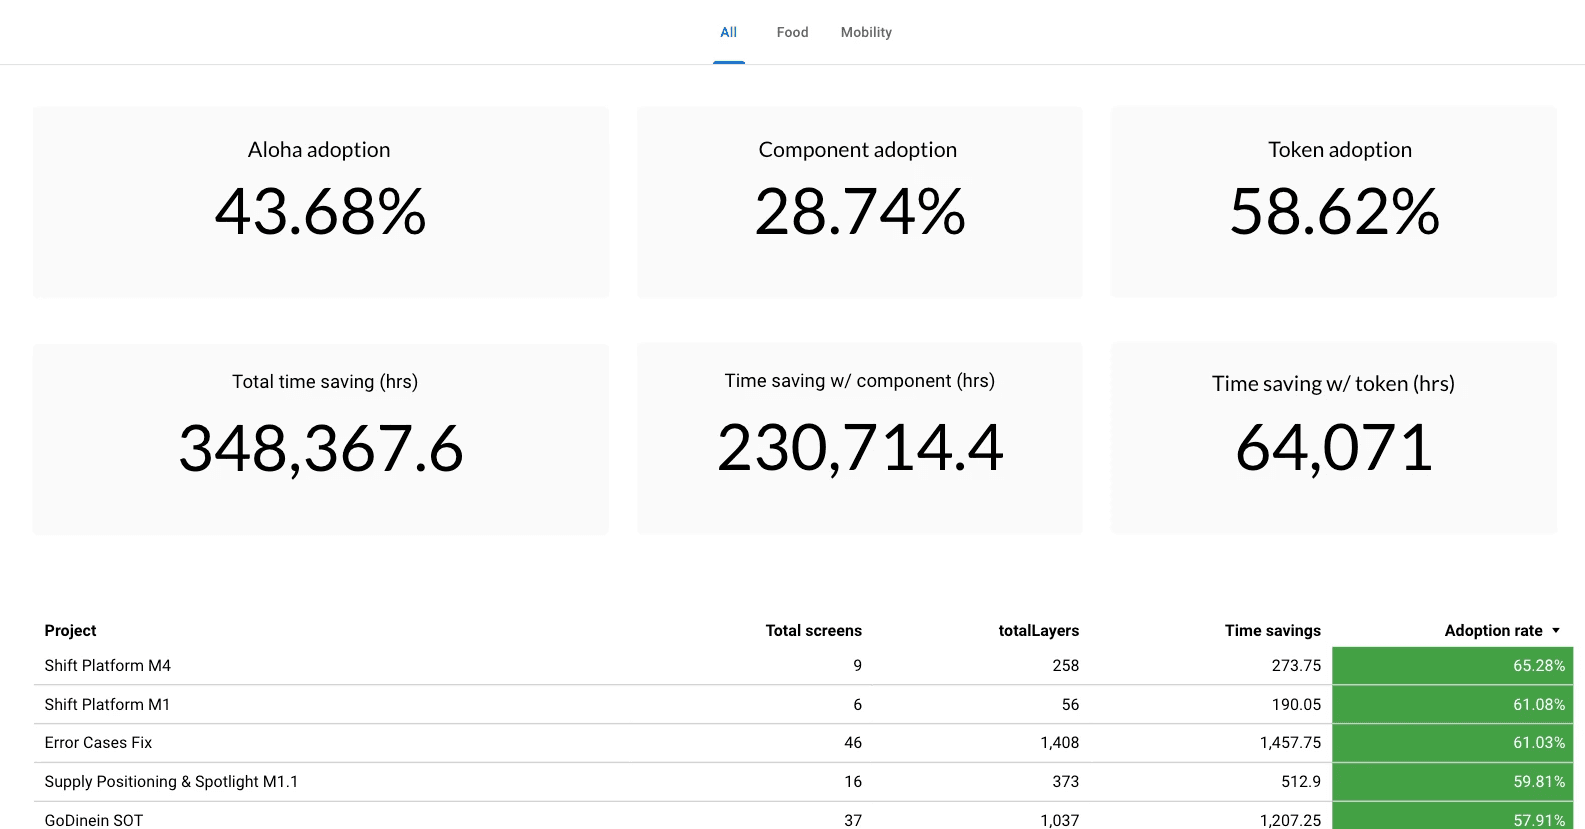
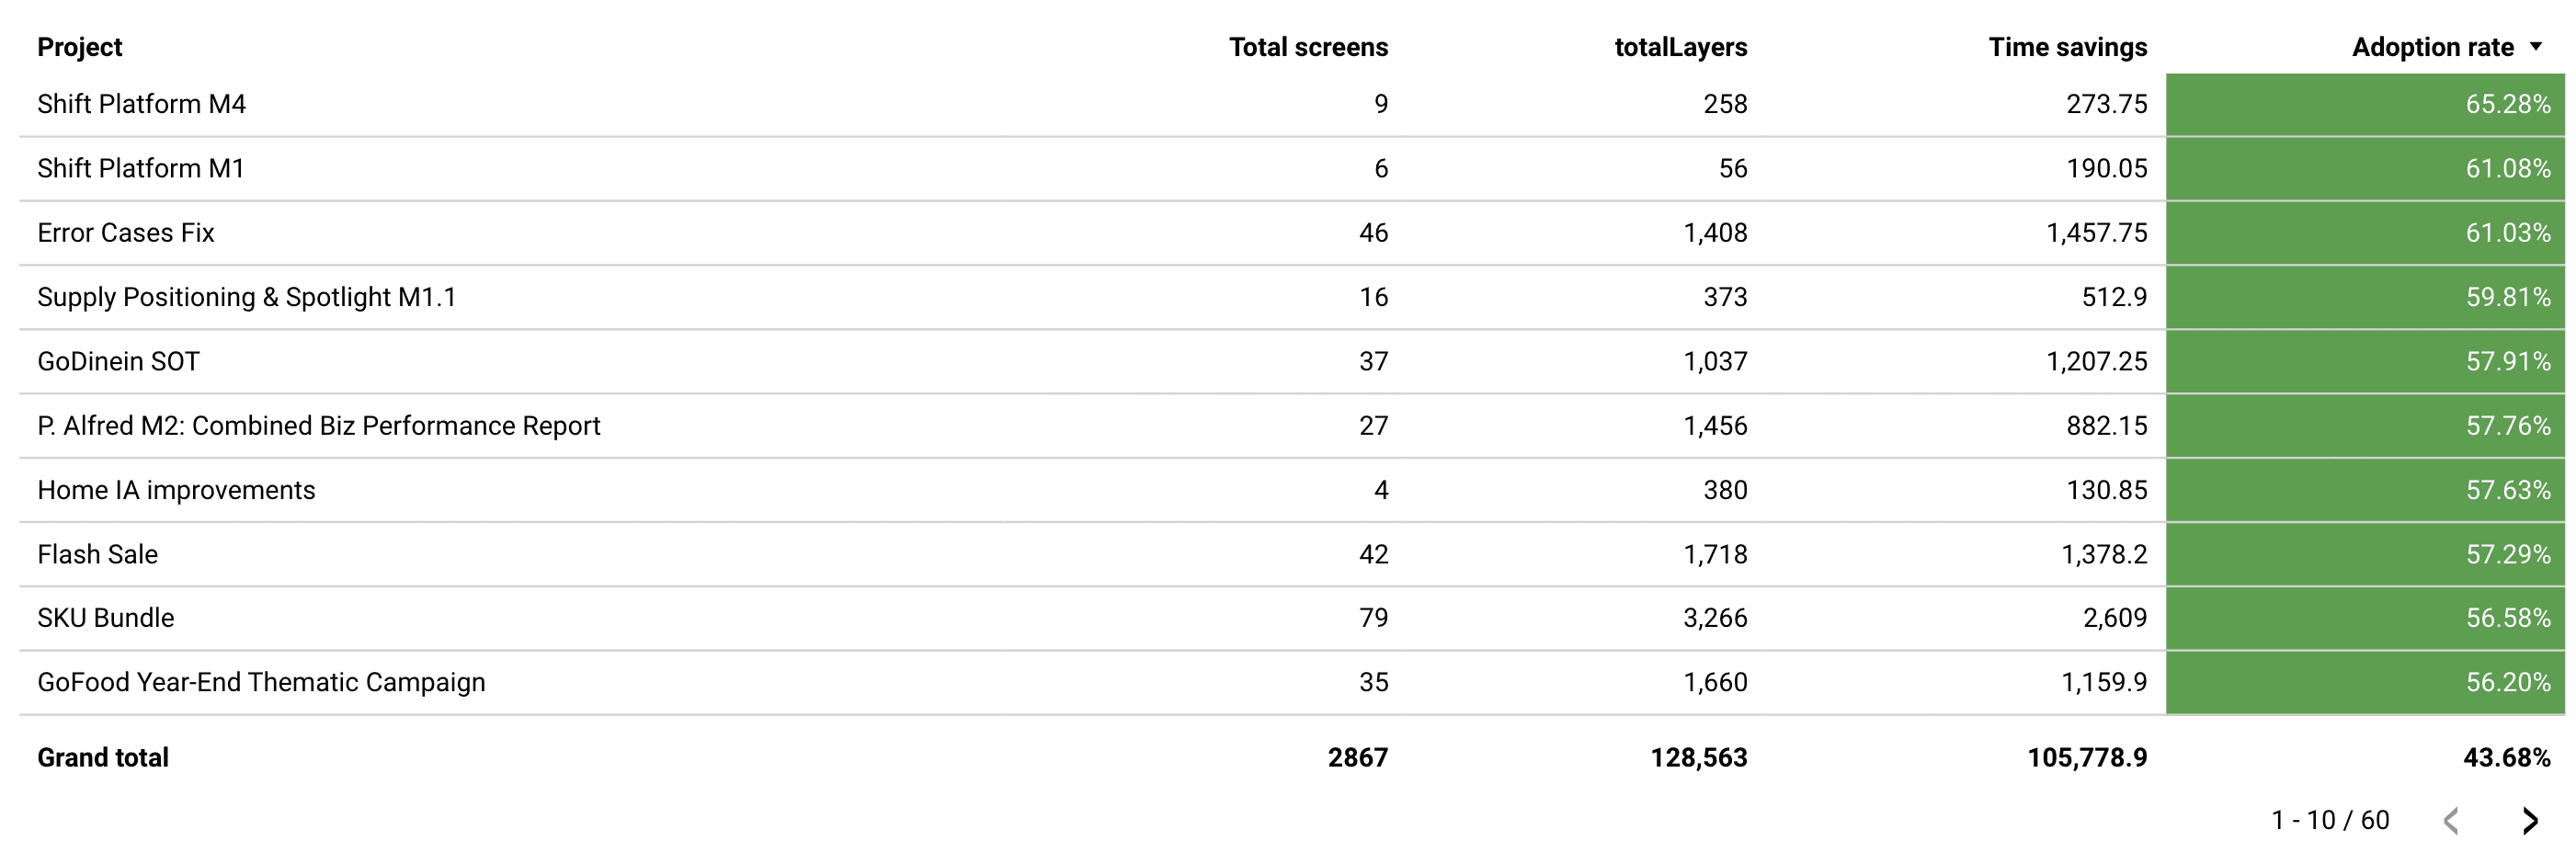
Adoption analytics – Quantify design system reach across products.
Exportable data – Enable deeper analysis and reporting beyond Figma.

My priority was to make the system work first: connecting APIs, defining data logic, and ensuring it produced reliable insights. Once the foundation proved valuable, visual refinement could follow.
I handled the entire frontend myself using Next.js and TypeScript, hosted as static pages on GitLab Pages.
Outcomes
Data-Driven Decision Making
Design teams now have tangible metrics to show adoption, highlight gaps, and prioritize improvements.
Improved Efficiency
Manual audits that once took hours are now automated and standardized.
Increased Credibility
Designers can back their decisions with data — strengthening alignment with product and engineering teams.
Visibility Across the Ecosystem
We can finally measure how design scales across multiple product verticals in Gojek.
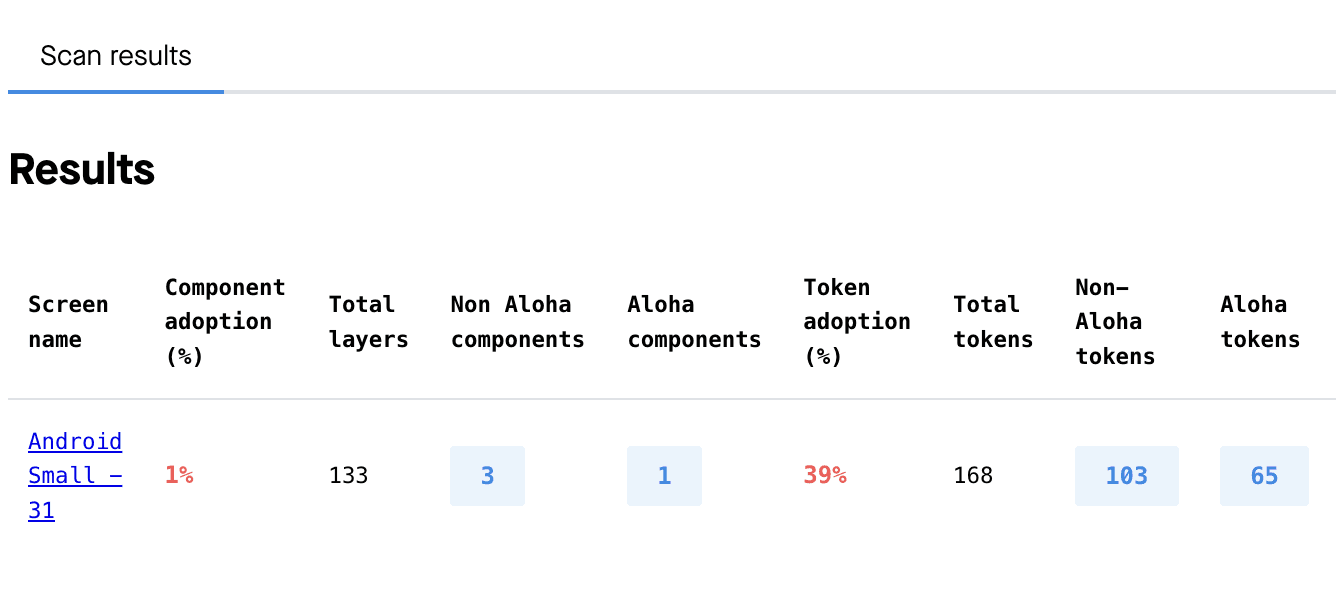
See it in action
The tool scans the inputted Figma file link and makes a series of calls to the Figma REST API to retrieve all relevant design data — including components, styles, text layers, and color tokens — which are then analyzed against predefined system rules.